Population-weighted annual average pollutant concentrations and associated health burden in cities in 2019. Toggle to select pollutant type/health estimates.

Population-weighted annual average pollutant concentrations and associated health burden in cities, in 2019.

Cities are not only at the front line for air pollution impacts, but also for progress and interventions.

Cities are often hotspots for poor air quality. As rapid urbanization increases the number of people breathing dangerously polluted air, city-level data can help inform targeted efforts to curb urban air pollution and improve public health.

Explore air quality and health data for your city using our new interactive app here.

Read the full report:

POLLUTION PRIORITIES

Most cities have polluted air, but the type of pollution varies from place to place.

It’s a simple fact: Most urban residents around the world are breathing unhealthy levels of pollution. While there are many forms of air pollution, two main pollutants are particularly important in urban environments: ambient (outdoor) fine particle air pollution (PM2.5) and nitrogen dioxide (NO2).

Ambient PM2.5 comes from vehicle emissions, coal-burning power plants, industrial emissions, and other sources. Because of their size – 2.5 micrograms or smaller – these tiny particles can easily get into the lungs, and in some cases, the bloodstream and impact our health in various ways. Nitrogen dioxide comes from many of these same sources, with vehicle traffic being a main source of NO2 in urban areas.

Research suggests NO2 exposure is not only linked to aggravation of asthma symptoms but is also linked to the development of asthma in children.

Comparing levels of these pollutants in cities around the world reveals strikingly different geographic patterns. PM2.5 pollution tends to be highest in low- and middle-income countries, whereas NO2 levels are high across countries of all income levels.


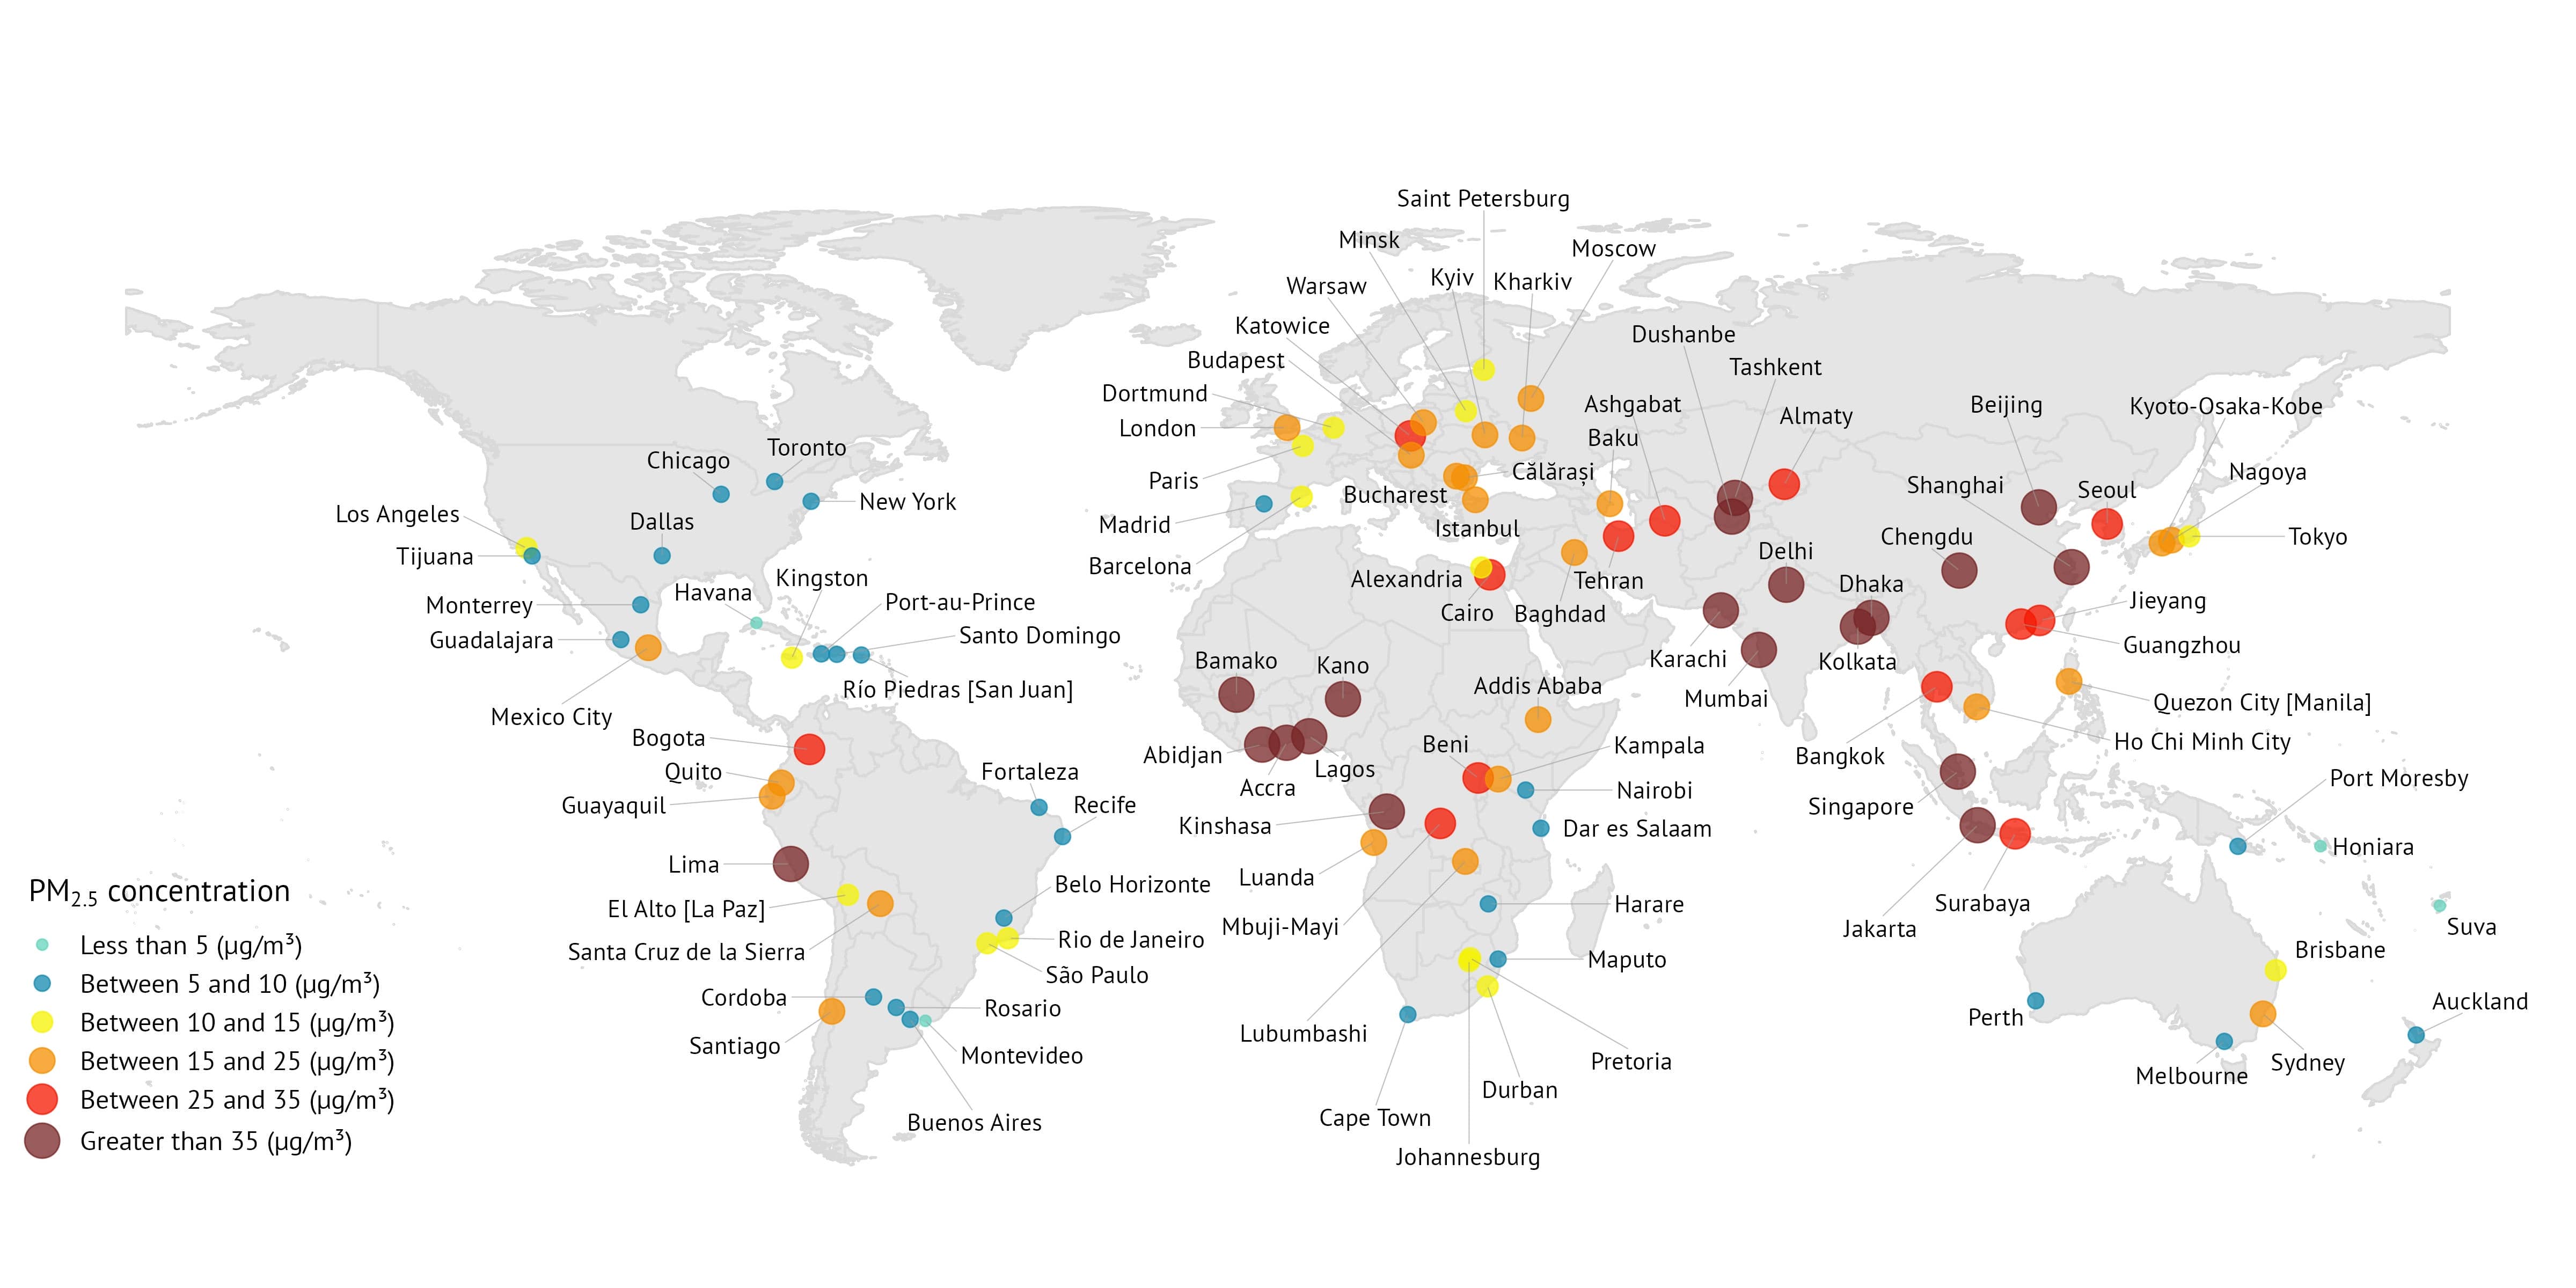
Map: exposure to PM2.5

Population-weighted annual average pollutant concentrations in the five most populous cities in each region in 2019.

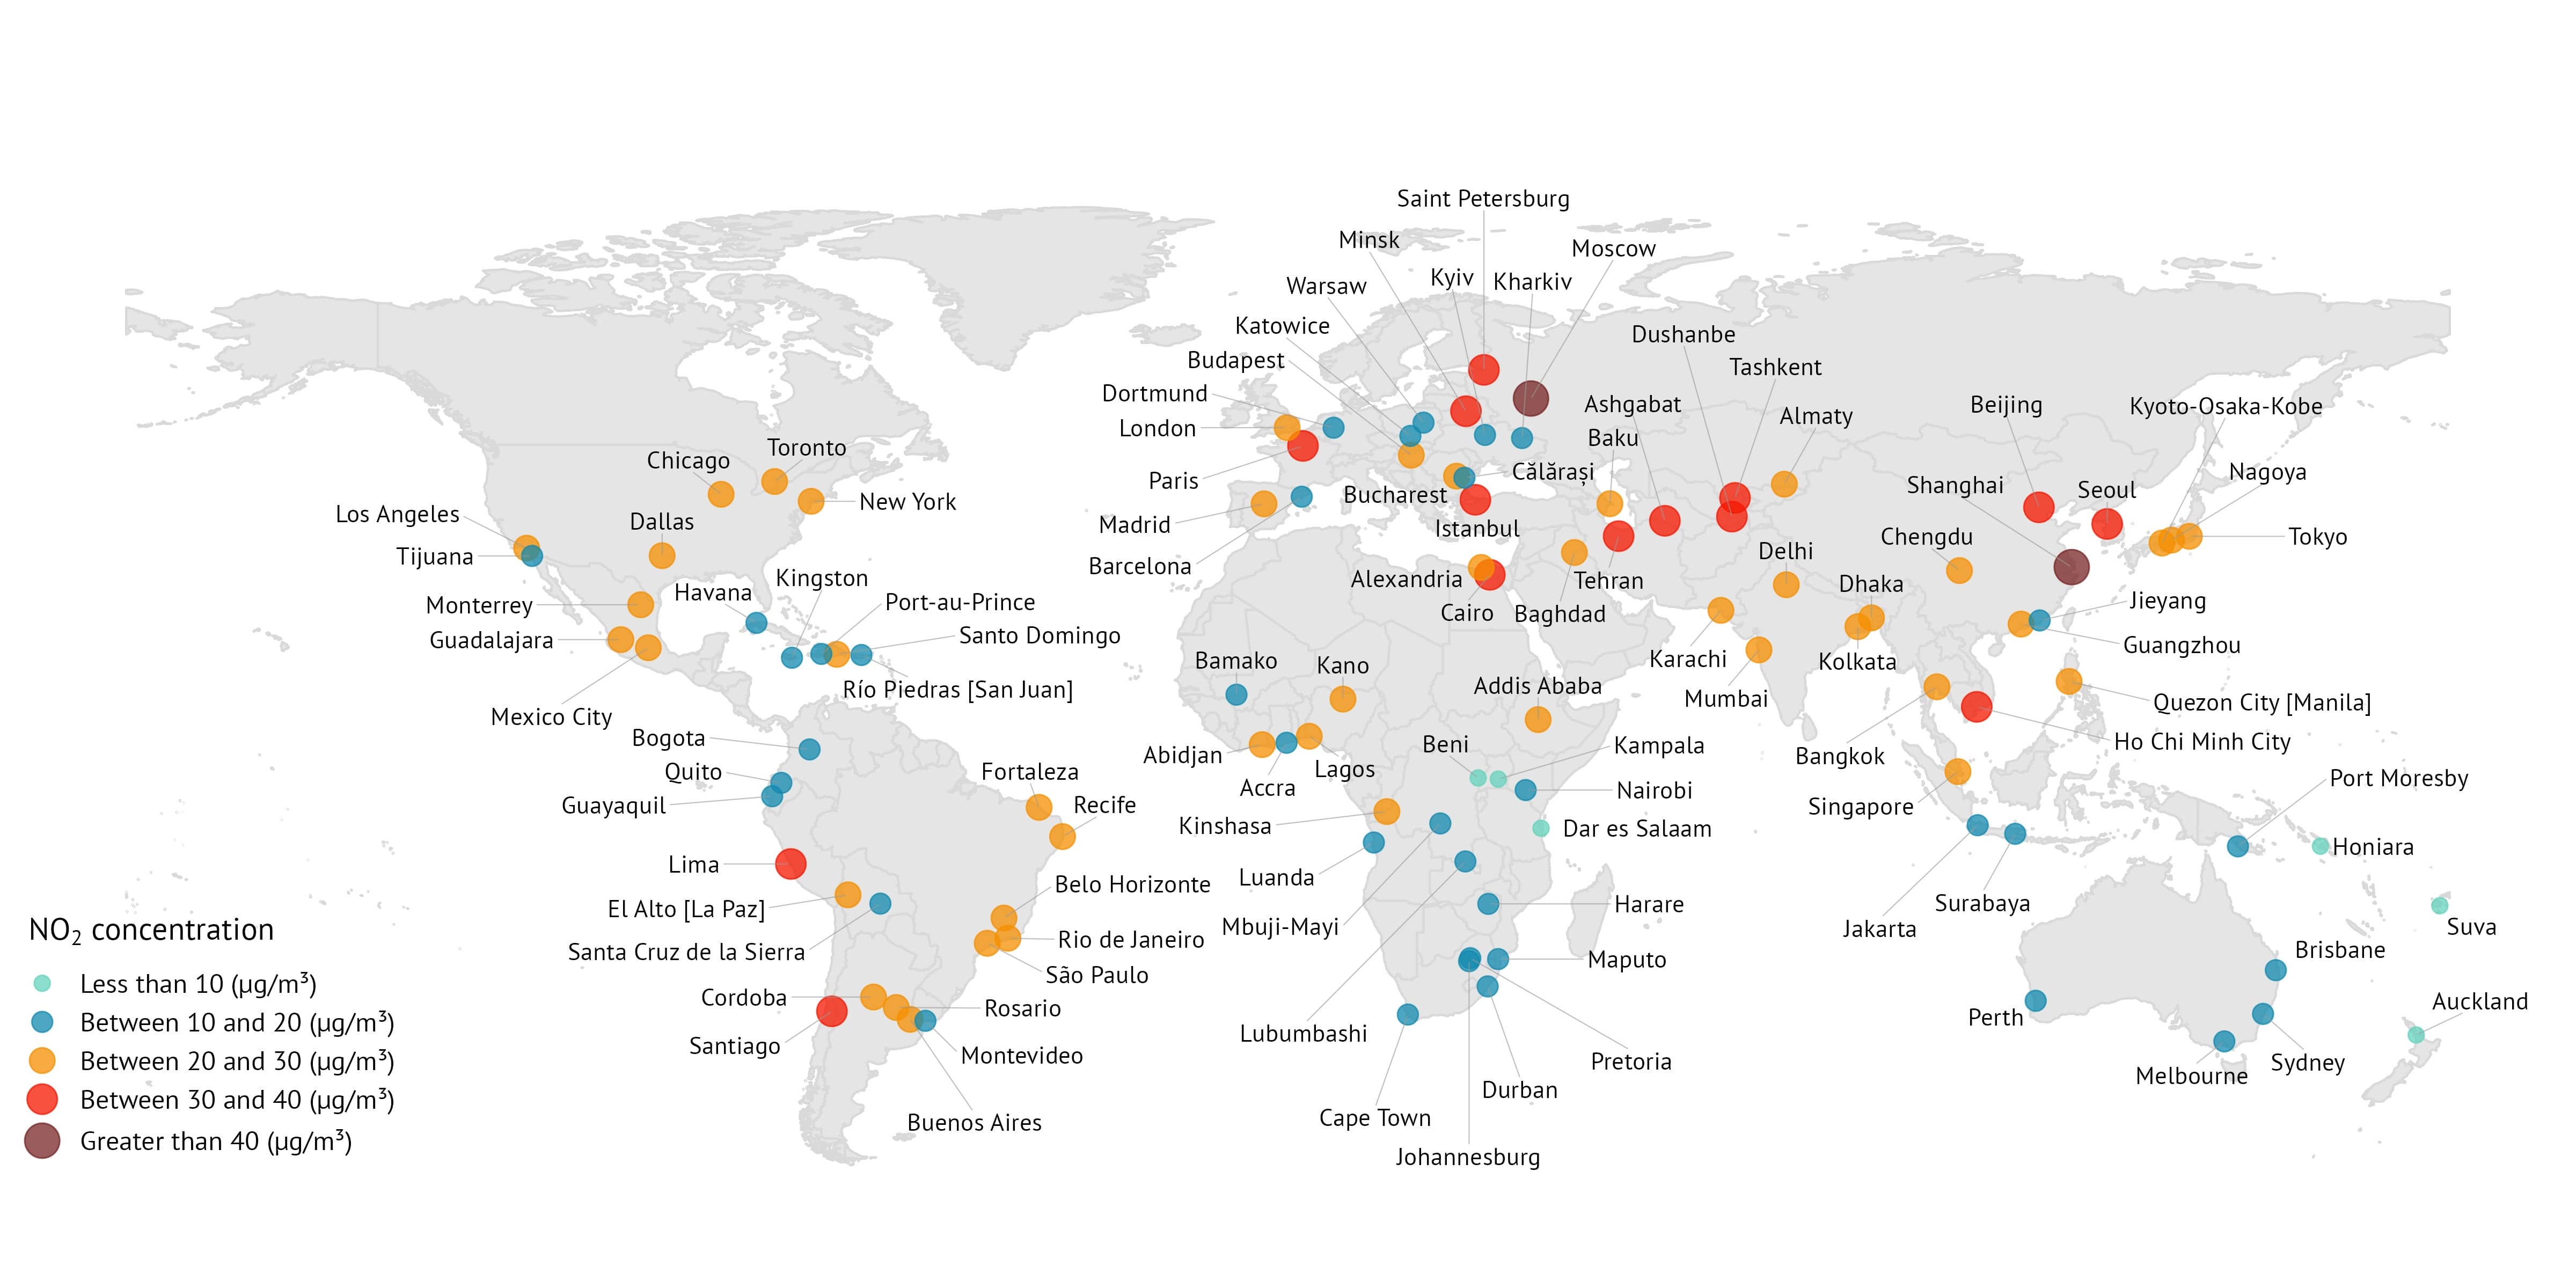
Map: Exposure to NO2

Population-weighted annual average pollutant concentrations in the five most populous cities in each region in 2019.

PM2.5 exposures are highest in populous cities located in South Asia, East Asia, Southeast Asia, West Sub-Saharan Africa, and Andean and Central Latin America. Cities in high-income regions see significantly lower levels of PM2.5 pollution.

Almost all people living in large cities are breathing high levels of NO2.

  • The most populous cities across all 21 regions (81 out of 103 cities) reported NO2 exposures higher than the global average of 15.5 µg/m3; the only exceptions were cities in Oceania, Australia, and Central and East sub-Saharan Africa.
  • Four large cities — Beirut, Lebanon; Shenyang, China; Shanghai, China; and Moscow, Russia, collectively home to over 53 million people — had NO2 levels that exceeded even the least stringent WHO guideline (40 µg/m3).

DIVERGENT TRENDS

Local policies have improved air quality in some cities, while pollution has worsened in others.

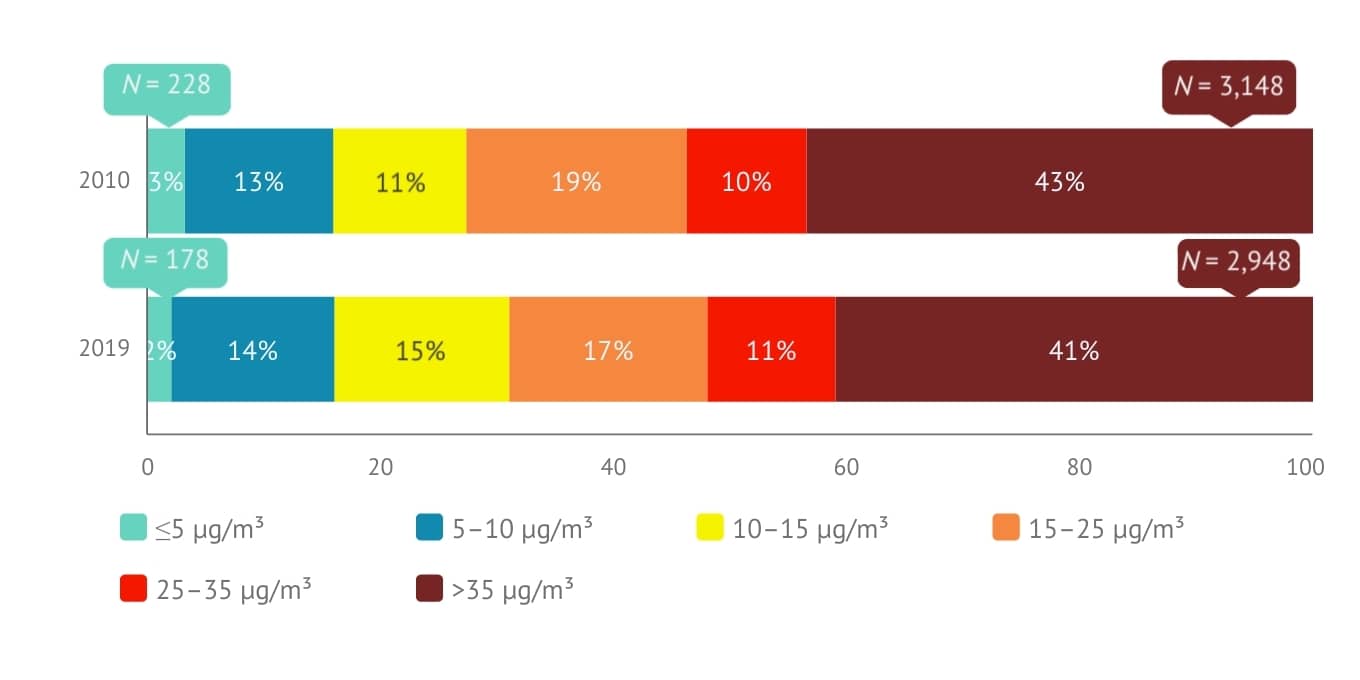
Overall, many cities have seen persistently high — and even rising — levels of air pollution over the past decade. PM2.5 exposures remained stagnant in many cities from 2010 to 2019. In 2019, 41% of the cities still experience PM2.5 levels that exceed even the least-stringent WHO PM2.5 interim target of 35 µg/m3, compared to 43% in 2010.

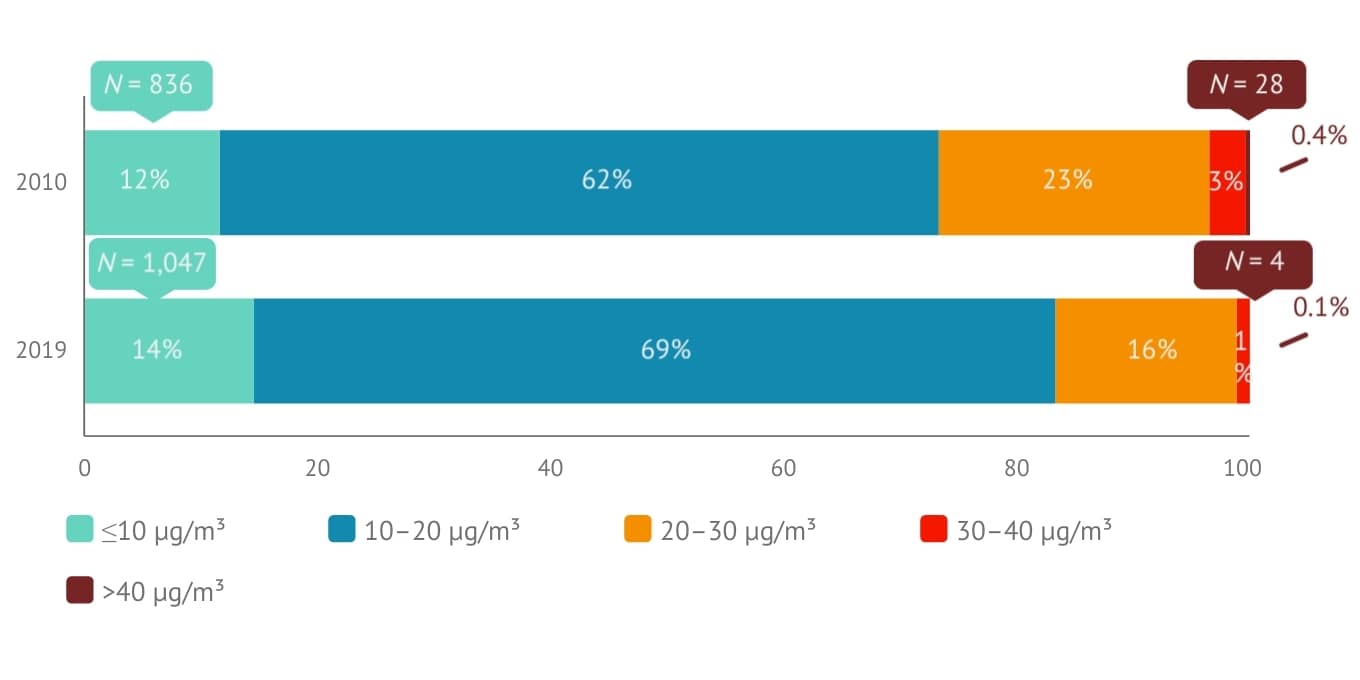
NO2 exposures have been falling in many cities, particularly in high-income regions and in East Asia. Globally, NO2 exposures are heading in an encouraging direction as 211 more cities met the WHO guideline of 10 µg/m3 in 2019 compared to 2010. However, NO2 pollution is worsening in some other regions.


Bar graph: PM2.5

Percentage of cities by population-weighted annual average pollutant concentration in 2010 and 2019.

Bar graph: NO2

Percentage of cities by population-weighted annual average pollutant concentration in 2010 and 2019.

However, interventions targeting pollution at the local scale have successfully improved air quality in some cities. For example,

  • Beijing, China, reduced its PM2.5 levels by 36% in just five years thanks to controls on power plant and industrial emissions along with new fuel quality and emission standards for vehicles. MORE
  • London’s Ultra Low Emission Zone initiative delivered a 36% reduction in NO2 in the first six months after its launch in 2019. MORE
  • Promisingly, mayors from more than 45 cities around the world have signed the C40 Clean Air Accelerator and made a commitment to provide healthy air for everyone and implement substantive clean air policies by 2025. MORE